25 Oct 2022
Basic entity resolution using graphs
As a reminder mnAi is leading the way in transforming unmanageable company datasets into meaningful data networks to uncover high-value insights. For instance, we have connected all UK companies, company officers and shareholders- a network of close to 100m relationships — to identify fraud and sales opportunities (among lots of other use cases).
The data model is based on the ‘POLE’ methodology (People, Object, Location, Event) which has a long history in criminal investigations. If you’ve ever watched a crime series you will be familiar — it’s that big whiteboard at the back of the room with mugshots and places of interest connected with a mishmash of connecting lines.
Due to the number of entities we track — some 21 million companies and 12 million company officers — we’ve done away with the whiteboard and use a database designed specifically for the task (if you are completely new to the concept of a graph database I suggest this 2 min intro).
The point of maintaining company data in this way is to enable network analysis which often uncovers things conventional approaches can not or which take them far too long to accomplish.
In our domain, one of the initial analyses is ‘entity resolution’ which answers questions such as:
- Have we got the right person?
- Are we sure we have all the information possible about them?
- Do they have aliases (via intentional obfuscation or honest error)?
When a dataset is small you can perhaps tackle this manually or with Excel, or with a relational DB when the data gets larger. In either case, you will soon get frustrated with the time it takes to answer the apparently simple questions above.
Compounding that frustration is the inescapable fact that any subsequent analysis will be based on the assumption you do indeed have the right person and the correct information about them. If not then your inputs are tainted and your findings will have blind spots. This causes the ‘we missed it’ line in the crime drama which ensures a second series.
Enter the graph. Rather than only focusing on the information about things graph databases provide equal weight to the information about the relationships between things and can do so quickly at scale.
Will The Real Thomas Johnson Please Stand Up?
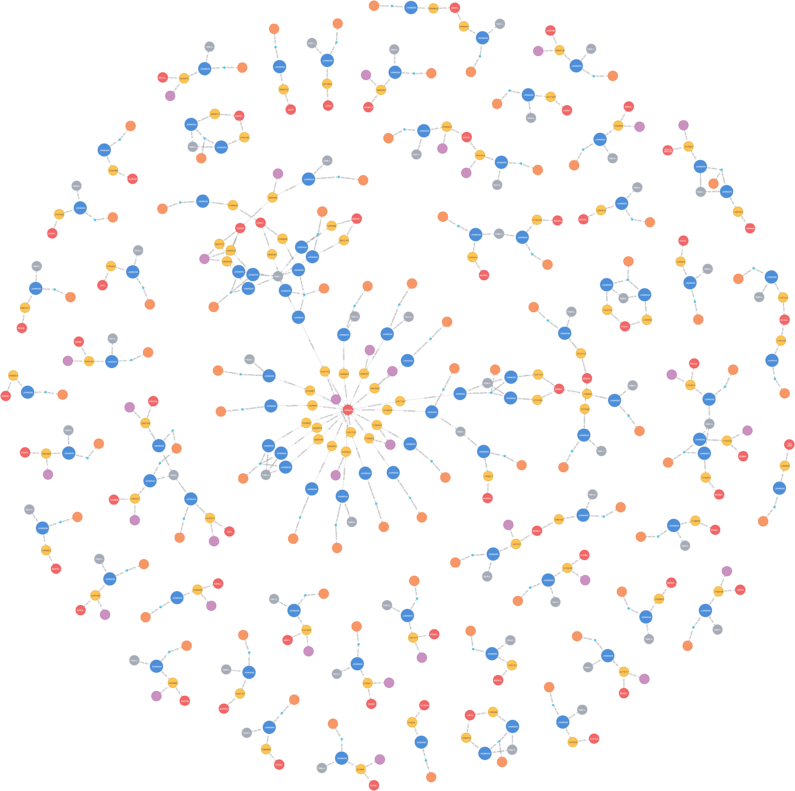
So let’s get to a concrete example. The image at the start of this article is a query I ran in our database which, in simple terms, says:
“Show me all the directors called Thomas Johnson along with the companies they’re associated with, places they lived and their dates of birth.”
Rather than return results as text in a table we return them as connected nodes. Let’s take a closer look at what we found.
Blue and orange nodes are company officers, yellow companies, red and purple locations and grey dates of birth.
In the middle is a spider web shape with a red node ‘London’ at its centre. These are all the Thomas Johnsons with a present or past address in London.
Just above and to the left is a cluster of nodes which does not look like the others — what’s going on here?
That cluster is held together by the date of birth but also shows 7 companies spread across 3 cities and 3 separate ‘Companies House’ master records. Without the date of birth holding everything together, this cluster would have split out and looked like the rest, essentially hiding the true story.
A next step, once we collect all the name, address, date and location data for our POI (person of interest) is to run subsequent queries to see if there are possible aliases or obscured connections. For example, show me:
- “all the people with that date of birth who ever lived at that post code”
- “all the companies incorporated around those dates in those towns”
- “with a fuzzy match of the name, any more connected companies”
Next Steps
This introduction to basic entity resolution using graphs showcases a simple visual analysis approach. In future articles, I will attempt to apply some higher-level graph voodoo such as:
- Profiling cluster shapes to find matches within the other 12m million directors; identifying others with similar conduct
- Use weights from clusters shapes as input to train ML models to predict director behaviour.
Mike Oaten, Head of Connected Data, mnAI