- National, regional and local macro and micro economic insight by GHGe
- Sectoral and industrial macro and micro economic insight by GHGe
- Growth and investment macro and micro economic insight by GHGe
- Employment numbers by GHGe
- Demographics by GHGe
- Autonomous supply chain benchmarking including GHGe
Emissions
mnAi’s data and technology helps clients manage risk, increase operational efficiency and deliver net zero pathways through measurement, analysis, management and target setting.
Our solution combines proprietary data and powerful technology to create new, clear actionable insights that will reduce risk, decrease operational expenditure and increase the chances of a successful Net-Zero transformation.
Download brochureOur integrated approach and solution also provides strategic added value by augmenting current data and risk makers.
Delivering Net Zero
A data-driven approach to managing emissions is an essential step for success. This can be implemented by data profiling before starting the process.
Data integration
Integrated data analytics will optimise workflow, client contact, and develop stronger data-led frameworks.
Data reconciliation
Extensive proprietary databases with automated data processing and reporting for bulk data submissions.
Expert advisory
Scope 1, 2 and 3 analysis of upstream and downstream impacts including best practice disclosure and communication.
The problem
- Lack of data on Micro, Small and Medium companies
- Data that does exist is unstructured and fragmented
- Gathering the data is expensive, time consuming and slow
The solution
- Technology first approach unifies disparate data sets
- Sophisticated engines extrapolate data
- New data sources augment and constantly update existing data
The benefits
- Combined economic and emissions data
- Autonomous supply chain benchmarking
- Enhanced data analytics and data quality
- Actionable insight
- Operational efficiency
- Augmented data profiling
Strategy
We provide data-driven solutions and expert advisory to help our clients develop and execute decarbonisation strategies.
Our products and services support measurement, either as part of ESG frameworks or for UK and/or international GHG emissions accounting and disclosure requirements, including SECR in the UK.
Solutions
Our online tools deliver core reporting outputs for external and internal company use.
From supply chain benchmarking and early warning indicators through to detailed analysis and reporting, we offer end-to-end, intelligent solutions to help you reduce your emissions footprint and simplify your carbon journey.

API
For larger companies or large data users, our APIs provide clients with the ability to measure emissions instantly using their existing data sets.
Data in action
Industrial insight
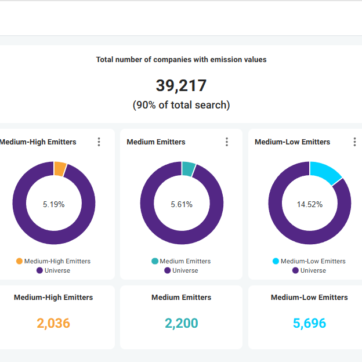
Company Profile
- Radial chart based on all emissions
- Pie chart based on % emissions per category
- Comparison chart – company v’s industry (actual)
- Comparison chart – company v’s industry (% per GHGe)
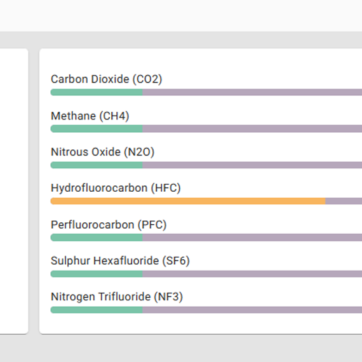
- Hierarchy charts showing summary and seven different emissions with colour coding
- Emissions table with summary description for all GHGe
- Comparison table – company v’s industry (actual)
- Comparison table – company v’s industry (% per GHGe)
- Reported Carbon KiloTonnage table
Person Profile
- Comparison table of all corporate involvement by summary and detailed GHGe
- Comparison chart at summary level of all involvement ranked by GHGe
- Individual radial charts for all corporate involvement
The exclusivity of the emissions data
Our proprietary and unique emissions data was developed in-house by our data science team with input from leading academics from Warwick University. Using a combination of public and proprietary data, we have created an emissions engine which assigns an emissions value (ie: Ultra-high, High etc) to all UK companies regardless of size.
The lack of data, insights and analysis of company-based emissions is a challenge for corporates and investors to hit Net Zero. mnAI’s data and technology aims to help clients manage risk, increase operational efficiency and deliver net zero pathways through measurement, analysis, management and target setting.
Current carbon solutions focus on the management of emissions accrued by a company through daily activity (scope 1 and 2); rather than emissions incurred through a direct/ in-direct suppliers (scope 3). Our solution allows for scope 3 emissions to be managed quickly and efficiently, providing granular analysis on a company’s supply chain – something that hasn’t previously been possible.
"In terms of emissions data for UK industry, this is without doubt the most significant jump forward in the last decade."
Hugo Kimber
Carbon Responsible
How can mnAi help with PCAF reporting?
PCAF developed the Global GHG Accounting and Reporting Standard for the Financial Industry (the Standard). This Standard has been reviewed by the GHG Protocol and conforms with the requirements set forth in the Corporate Value Chain (Scope 3) Accounting and Reporting Standard for category 15 investment activities.
The Standard provides detailed methodological guidance for asset classes. Widely tested by banks and investors, these methods assist in the measurement and disclosure of GHG emissions associated with six asset classes:
- Listed equity and corporate bonds
- Business loans and unlisted equity
- Project finance
- Commercial real-estate
- Mortgages
- Motor Vehicle Loans
mnAi can provide assistance and data relating to business loans and unlisted equity
We can do so as follows:
Financial reporting data
- The most recent financial statements provided private companies
- Updated SIC/ Sector classifications
- Details of up/downstream equity held in private companies
- Details of business loans provided to private companies by other lenders
- Details of commercial mortgages provided to private companies by other lenders
Non-Financial
- Sector analysis covering 2024 and 2026 mandatory reporting obligations
- Details of land or property ownership
- Customer and investment portfolio emissions in whole,
or in part - Automated supply chain analysis and further downstream supply chain analysis of the suppliers of the suppliers
Supply chain additional
- We recognise that certain suppliers may provide more than one service type with different emissions attributed to different activities. Should this be required, we will benchmark different service lines against known single-suppliers of the same service line.
PCAF stipulate limited data is often the main challenge in calculating financed emissions; however, data limitations should not deter financial institutions from starting their GHG accounting journeys. Beginning with estimated or proxy data can help identify carbon-intensive hotspots in lending and investment portfolios.
The mnAi data set covers:
- All active UK companies over one year old
- All UK sectors as defined by SIC 2007
How would the solution work?
- The only data mnAi would require to start the process would be the company name and/or company number
- Real-time data fed through API to create a new, proprietary data-lake
- Data would be accessed through:
- Dedicated API built by mnAi,
- Amazon’s Data Exchange (ADX),
- Snowflake,
- NayaOne Sandbox
How long would the solution take to incept?
This would depend on the solution chosen – further information on all options is available on request.
Additional benefits:
The data we hold both complements and works alongside PCAF and Global GHG Accounting and Reporting Standards, effectively giving more accurate data and acting as an early warning system. This helps the organisation as well as the relationship and business development managers to understand the current customers’ GHG emissions. This would allow them to effectively manage risk, increase operational efficiency and deliver net zero pathways through measurement, analysis, management, and target setting.
Scope 1, 2 and 3 PCAF definitions
Scope1
Direct GHG emissions that occur from sources owned or controlled by the reporting company – i.e., emissions from combustion in owned or controlled boilers, furnaces, vehicles, etc.
Scope2
Indirect GHG emissions from the generation of purchased or acquired electricity, steam, heating, or cooling consumed by the reporting company. Scope 2 emissions physically occur at the facility where the electricity, steam, heating, or cooling is generated.
Scope3
All other indirect GHG emissions (not included in Scope2) that occur in the value chain of the reporting company. Scope 3 can be broken down into upstream emissions that occur in the supply chain (for example, from production or extraction of purchased materials) and downstream emissions that occur as a consequence of using the organization’s products or services.
PCAF sector reporting obligations
NACE L2 sectors considered
From 2021: At least energy (oil & gas) and mining (i.e., NACE L2: 05-09, 19, 20)
From 2024: At least transportation, construction, buildings, materials, and industrial activities (i.e., NACE L2: 10-18, 21-33, 41-43, 49-53, 81)
From 2026: Every sector
Request a demo
Access unrivalled insight into millions of UK companies
Receive a personalised, interactive demo of the mnAi platform by filling out our form. Alternatively give us a call on 020 3151 6624 or message the team at sales@mnai.tech